Crude Oil News Today: Prices Tumble Amid Geopolitical Calm, Weak Demand

Multiple Factors Weigh

Crude oil prices have faced a complex array of influences this week, with geopolitical tensions and fluctuating demand painting a mixed picture for the market. As Brent and West Texas Intermediate (WTI) prices fluctuate, a myriad of factors come into play, impacting both short-term valuations and longer-term market expectations.

Experts Trade WTI Crude Oil with IC Markets

Trading Derivatives carries a high level of risk to your capital and you should only trade with money you can afford to lose. Trading Derivatives may not be suitable for all investors, so please ensure that you fully understand the risks involved, and seek independent advice if necessary. A Product Disclosure Statement (PDS) can be obtained either from this website or on request from our offices and should be considered before entering into a transaction with us. Raw Spread accounts offer spread

Geopolitical Tensions and Market Reactions

The recent reinstatement of U.S. sanctions on Venezuela’s oil industry was overshadowed by other global events that exerted a heavier influence on oil prices. Notably, the market’s reaction to potential conflict escalations between Israel and Iran has been surprisingly subdued.

Despite Israel’s Prime Minister Benjamin Netanyahu’s firm stance on retaliating against Iran for recent aggressions, oil prices have not spiked as might be expected given Iran’s significant role in OPEC. This suggests that investors might be anticipating a controlled avoidance of escalated conflict, thereby limiting a surge in risk premium.

Adding to the bearish sentiment, the Energy Information Administration (EIA) reported an unexpected rise in U.S. crude inventories, with stocks reaching their highest level since June 2023. This increase, coupled with lower refinery utilization, has contributed to downward pressure on oil prices.

Moreover, global oil demand has been weaker than expected. JP Morgan’s recent update highlighted that demand has been running 200,000 barrels per day (bpd) below their forecast since April, with an annual increase much lower than anticipated.

Short-Term Forecast

In the immediate term, the oil market is likely to remain bearish. The combination of rising U.S. stockpiles, subdued global demand, and investor sentiment leaning towards the avoidance of Middle Eastern conflict suggests that oil prices may continue to struggle to find higher ground.

Furthermore, as U.S. gasoline and distillate inventories show diverging trends, the focus will increasingly shift to consumer demand patterns, especially with the upcoming U.S. summer driving season. However, any sudden geopolitical shifts or significant changes in inventory levels could swiftly alter this outlook. For now, traders should brace for potential volatility, with a leaning towards a bearish market scenario in the near term.

Technical Analysis

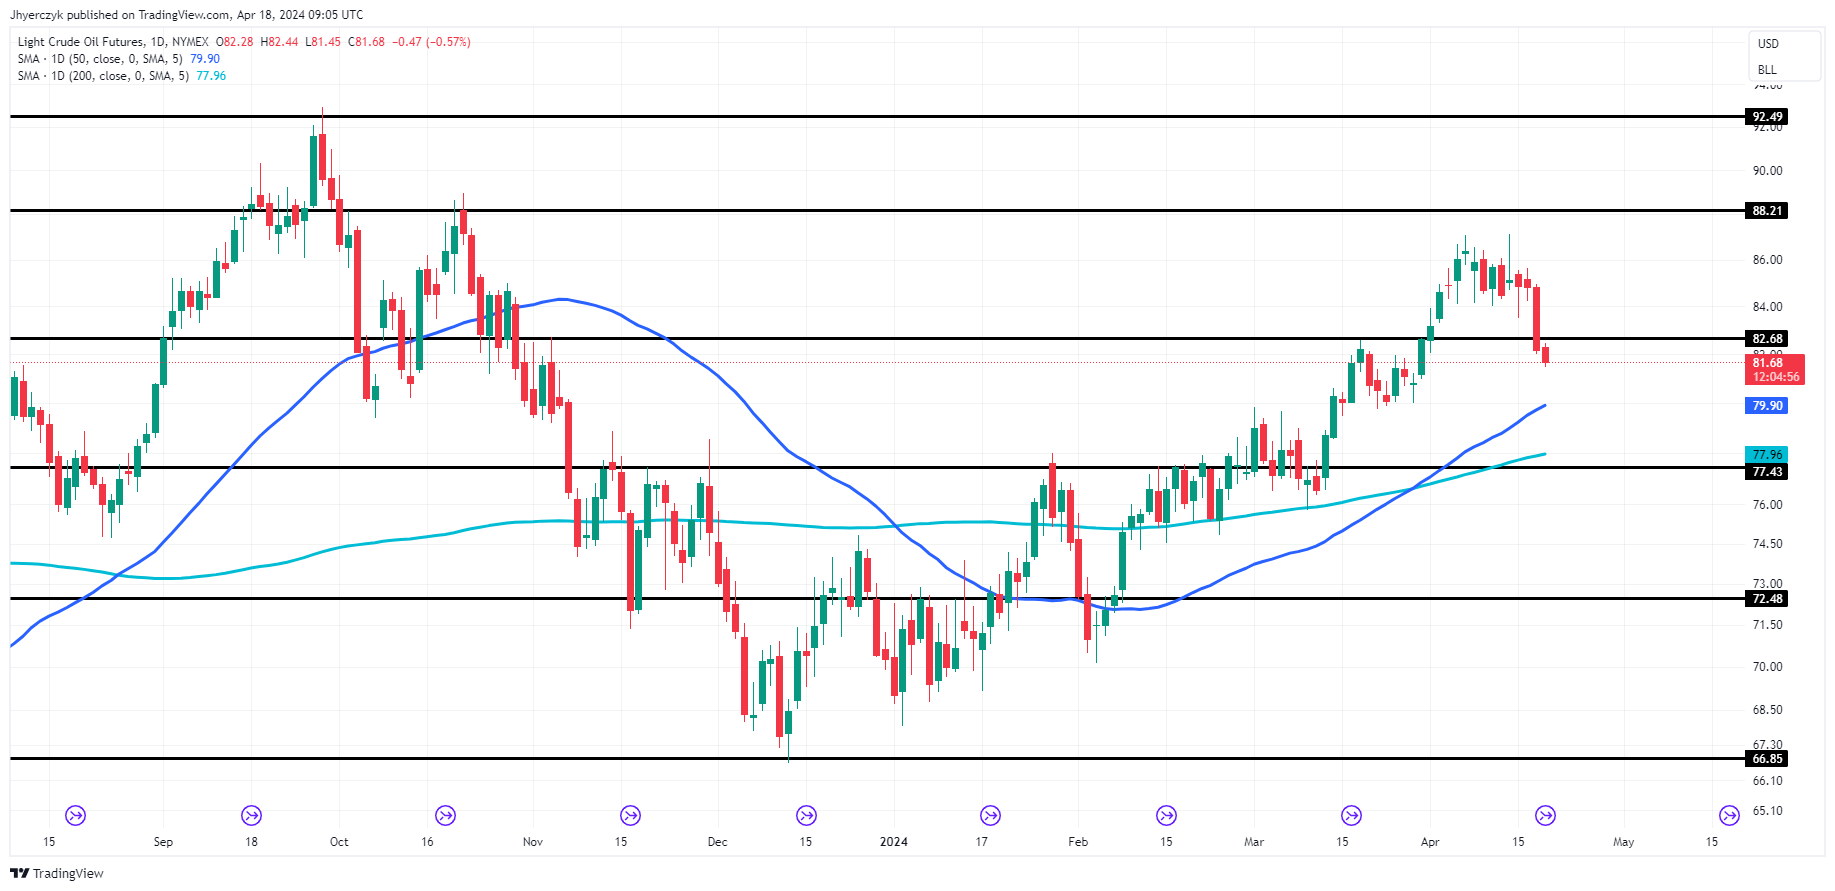
Daily Light Crude Oil FuturesThe short-term trend is down. Based on the current downside momentum, Light Crude Oil Futures appear headed into a test of the 50-day moving average at $79.90. Look for a techical bounce on the first test of this level. If it fails then the selling pressure is likely to extend into the 200-day moving average at $77.96.

A trade through $79.90 will change the intermediate trend to down. A move through $77.96 will indicate a change in the long-term trend.

Recapturing $82.68 could trigger the start of a short-covering rally, but not necessarily a resumption of the uptrend.

Gold (XAU/USD) Price Holds Steady Amid Pause in Middle East Tensions

Israel is still likely to respond to Saturday’s drone and missile attack by Iran, despite the latest diplomatic efforts by other countries to try and calm the situation in the Middle East. After talks with the UK and Germany yesterday, Israel’s Prime Minister Benjamin Netanyahu thanked both for their advice but warned of retaliatory action ahead.

“They have all sorts of suggestions and advice. I appreciate that. But I want to make it clear – we will make our own decisions, and the state of Israel will do everything necessary to defend itself.”

According to a report in The Daily Telegraph, Israel is unlikely to carry out retaliatory action before the end of Passover (April 30).

With a potential lull in Middle East tensions now seen until the end of the month, gold will need a new driver to keep it at its current elevated levels. The US dollar backed off from its recent multi-month highs overnight, helping the precious metal consolidate. The US dollar has rallied hard since early March, and this move accelerated last Wednesday after data showed that US inflation is refusing to move towards the central bank’s target. Technical support from all three simple moving averages on the daily chart is set to keep the US dollar higher for longer.

US Dollar Index – April 18th, 2024

image1.png

The price of gold remains within touching distance of its recent all-time high at $2,431.8/oz. and if the situation in the Middle East escalates, this high is likely to be breached. Gold is moving out of heavily overbought territory, while the recent multi-month ATR is starting to turn lower. The precious metal may see a period of consolidation over the coming days before the situation in the Middle East dictates the next move.

Gold Daily Price Chart – April 18th, 2024

image2.png

Chart

Retail trader data shows 50.75% of traders are net-long with the ratio of traders long to short at 1.03 to 1.The number of trader’s net long is 2.08% lower than yesterday and 2.19% lower than last week, while the number of trader’s net short is 3.89% lower than yesterday and 8.03% lower than last week.

We typically take a contrarian view to crowd sentiment, and the fact traders are net-long suggests Gold prices may continue to fall. Traders are further net-long than yesterday and last week, and the combination of current sentiment and recent changes gives us a stronger Gold-bearish contrarian trading bias.

USDZAR Price Forecast: Rand Remains Steady after Local CPI Inflation

USD/ZAR Key Takeaways:

1. Moderate Decrease in Inflation: In March 2024, consumer price inflation for urban areas saw a slight decrease to 5.3% from 5.6% in February.

2. Key Drivers of Inflation: The annual inflation rate was significantly influenced by increases in housing and utilities, miscellaneous goods and services, food and non-alcoholic beverages, and transport costs.

3. Shift in Goods vs. Services Inflation Rates: The inflation rate for goods fell from 6.2% in February to 5.7% in March, whereas the inflation rate for services saw a marginal rise to 5.0% from the previous month’s 4.9%.

4. SARB’s Monetary Policy Outlook: The current outlook hints at a possible reduction in rates in the latter half of 2024.

5. Influence of Global Monetary Policy Trends: The SARB’s decision-making regarding interest rate cuts will likely be influenced by monetary policy trends in developed economies.

March CPI in brief

In March 2024, the Headline Consumer Price Index (CPI) for urban areas indicated that annual consumer price inflation decreased slightly to 5.3% from 5.6% in February, with a month-on-month increase of 0.8%. The main drivers of this annual inflation rate included housing and utilities, miscellaneous goods and services, food and non-alcoholic beverages, and transport, contributing significantly with increments ranging from 5.1% to 8.5% year-on-year. Notably, the inflation rate for goods decreased to 5.7% from February’s 6.2%, while the rate for services experienced a slight increase to 5.0% from 4.9%.

SARB Monetary Policy / Rates Outlook

The slight tick lower in inflation will be welcomed by the South African Reserve Bank (SARB) but CPI remains elevated and closer to the ceiling of the 3% to 6% targeted range. Current expectations suggest that rates could start to lower in the second half of the year through 25 basis point increments, at best three times (totaling 0.75% by the end of 2024). The SARB is likely to follow the lead though of developed economies such as the US to try to stem capital outflows and protect carry trade opportunities. With the US Federal Reserve becoming a little more hawkish as of late and starting to lean away from the more dovish ‘pivot’, perhaps three rate cuts this year in South Africa are starting to look too optimistic.

USD/ZAR Technical View

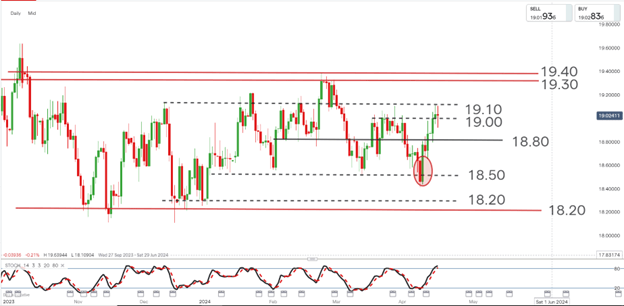
After a failed downside break, the USD/ZAR has produced a sharp bullish price reversal from around the 18.50 level and from oversold territory. The reversal has taken the price through the 19.00 level and is now testing the 19.10 level whilst in overbought territory.

Traders might look for either an upside break of the 19.10 level for long entry or a bearish price reversal off this level for short entry.

Should the upside break trigger (confirmed with a close above), the 19.30 to 19.40 range provides the upside resistance target from the move, while a close below the 19.00 level would suggest the move has failed.

Should a bearish price reversal instead form off the 19.10 resistance level, confirmed with a close below 19.00, 18.80 becomes the initial support target, while a close above the 19.40 level might be used as a failure indication.

The Golden Cross

The Golden Cross: What is it and How to Identify it when Trading?

The ‘golden cross’ is a term often mentioned in trading circles due to its usefulness in spotting changes in trends while also being incredibly easy to use. This article will explain the concept of the golden cross, how to identify the golden cross and explore complementary indicators to use alongside the simple moving averages when analyzing changing trends.

What is a Golden Cross?

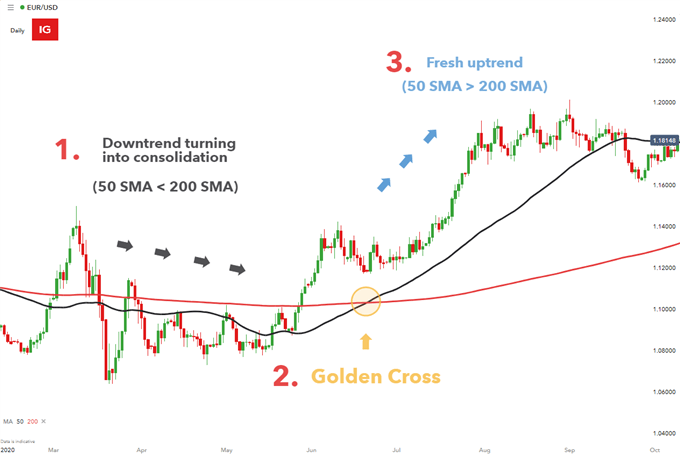
A golden cross occurs when the 50 simple moving average (SMA) crosses above the 200 SMA. The golden cross provides a bullish backdrop to the market as short-term price momentum advances higher, with the potential to evolve into a new long-term trend (uptrend).

The 50 SMA is an arithmetic average of closing price levels over the last 50 periods or days, if you are using the daily chart for example. Therefore, the 50 SMA is more reactive to more recent price movement than the 200 SMA, which averages out the last 200 closing prices and tends to create a smoother line, less reactive to recent prices than the 50 SMA.

How to Identify a Golden Cross

There are three main stages to the formation of the golden cross:

1. The lead up: Price action consolidates or, in some scenarios, turns sharply higher after trending lower for a considerable period of time. This provides the initial clue that the downtrend may be starting to lose momentum and could even result in an eventual trend reversal. The 50 SMA remains below the 200 SMA during this stage.

2. The golden cross: This is the exact moment the 50 SMA crosses above the 200 SMA, providing the bullish backdrop for the market known as the golden cross. The golden cross is often interpreted as a trigger to look for entries into the market.

3. Continued upward momentum: Price action advances higher after the golden cross is observed, often creating a fresh new trend (uptrend). Ideally, in this stage you may observe the shorter 50 SMA acting as dynamic support for price action and price continues to trade above the 50 SMA for some time.

The Golden Cross

The Simple Moving Average as a Lagging Indicator

By its very nature the simple moving average is a lagging indicator, meaning that it relies on past price action to provide assistance when analyzing current market conditions. Inherently, the SMA has a lag period, resulting in the signal being produced some time after the move has occurred.

Some may view this as a lost opportunity while others may appreciate the delayed signal as it may provide a greater level of conviction that the trend has indeed changed and we aren’t simply witnessing a short term retracement. Shorter-term traders like scalpers and day traders, seeking to capitalize on smaller moves, can make the indicator more responsive by simply reducing the short-term and longer-term moving averages when adjusting the input criteria.

Useful Indicators to Use with SMAs

For a trend to develop, a market first needs to break out of an existing range or consolidation phase. This can be analyzed purely from a price action point of view (observing price breaking above resistance or below support) or via the use of an indicator.

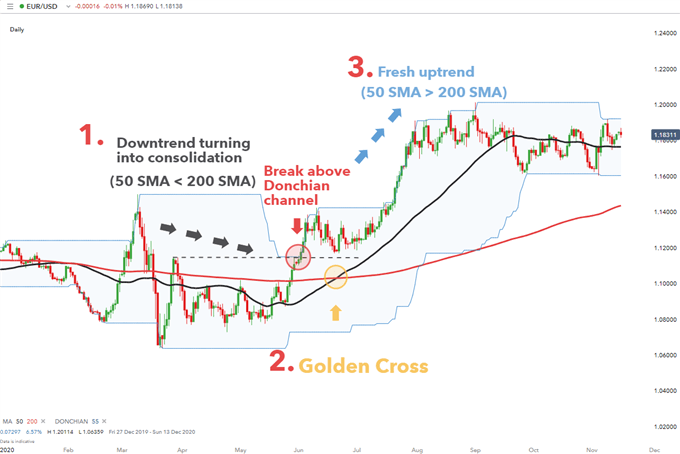
  • Donchian Channel: The Donchian channel indicator identifies the high and low for a period of time and carries these levels forward on the chart to better visualize significant levels that contain price action. A break above or below these levels with sustained momentum could indicate the start of a long-term trend.

The chart below depicts a break above the Donchian channel with continued momentum (red circle), suggesting that a new trend may be emerging.

Golden Cross with Donchian aka Price Channels applied

Since the golden cross seeks to identify a bullish trend reversal, it makes sense to use trend following indicators after the market has broken out of a period of consolidation.

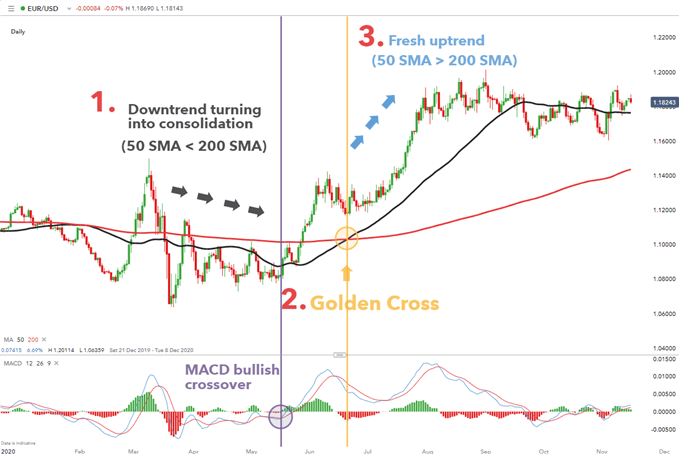
  • Moving Average Convergence Divergence (MACD): the MACD is a technical tool that averages price over a period of time. The smoothing effect this has on price charts help give a clearer indication on what direction the pair is moving.

Below it can be seen that the MACD actually provides the first indication of a new potential uptrend with the bullish MACD crossover (purple circle). This provides the initial basis of the bullish bias which is later reinforced by the golden cross which provides further support of the bullish bias.

The Golden Cross

Mistakes Traders Frequently Make & How to Fix Them

MISTAKE #1 – NO TRADING PLAN

Too few traders have an actual game-plan, effectively they are ‘flying blind’. Your trading plan doesn’t need to be super detailed, a few pages is sufficient. But the more details the better. You plan should include risk management parameters, outline of your decision-making process, preferred trade set-ups (include a few examples for reference), and how to handle both drawdowns as well as successful periods.

MISTAKE #2 – POOR RISK MANAGEMENT

One of the biggest mistakes traders make is poor risk management. Risking too much per trade is a pitfall traders must avoid. You have to trade within your comfort zone, otherwise your decision making process will be severely impaired. Fear and anxiety will almost certainly cause you to make mistakes that will lead to frustration and more mistakes. Inconsistency in position-sizing is another big problem and leads to inconsistent results. You should keep your range of risk-per-trade relatively tight. For example, risking 0.5% on one trade, then 3% on another is going to make being consistent very difficult.

Poor risk ratios is also another issue. All too often traders will have risk/reward ratios of 1:1 or worse. This forces you to be right far more often than wrong. Depending on your style of trading, having a win rate of 50% is reasonable, but at 1:1 you will only break even (not accounting for transaction costs). You want to tilt risk/reward in your favor and make sure you are getting paid for the risk you are taking. Risk/reward ratios of 1:2 offer this kind of desired asymmetry in your risk profile.

Make sure you are always using stops and most importantly that you stick to them. Not using stops is a dangerous way to play, and moving them is effectively the same as not using them.

Understand your total risk across all positions held simultaneously. You may be holding three positions with normal risk on per position, but due to high a correlation between the trades you are effectively holding one large position. For example, if you are long three JPY pairs then you should treat the three individual positions as one larger and spread your risk across the three positions.

MISTAKE #3 – UNDERCAPITALIZED

You need to understand your own personal financial situation and risk only what you can afford to lose. Knowing the downside is not only prudent money management, but will also reduce the stress caused by risk and uncertainty that you can’t afford.. Trading is hard enough without adding extra layers of stress and complication.

MISTAKE #4 – OVER-TRADING

Traders fall victim to this all the time. An overabundance of mediocre trades mixed in with high quality trades will equate to sub-optimal performance. There is often an inverse correlation that exists between level of activity (#of trades) and profitability. High number of trades = lower profitability while a lower trade count = higher profitability. Often when a trader is more selective when choosing their opportunities (i.e. sticking to a solid trading plan), they are far more efficient.

How can we become more efficient? Use a checklist which helps keep you on the right path. The checklist should reflect your trading plan. For newer traders, it is recommended that a physical checklist is used, but as you become more experienced you will be able to go through the process in your head. A checklist of reasons for entering a trade and risk parameters will help you avoid trades you shouldn’t be in.

MISTAKE #5 – OVERCOMPLICATE

Remember this acronym – K.I.S.S. Keep It Simple Stupid. More is not necessarily better, more is often times just more. Confluence between two or more factors can make for a sound approach, but make sure those factors aren’t highly correlated. For example, you don’t need three different methods of defining a trend or overbought/sold conditions.

A good combination for a technical trader might be – one factor each for identifying each the trend, support/resistance, overbought/sold, and price action quality. This combination would make for a well-rounded approach that relies on unrelated factors to build a case to trade or not.

MISTAKE #6 – FOCUSED ON RESULTS NOT THE PROCESS

Traders often get hung up on the results from trading, which is understandable. But like any performance-based activity this will prove highly detrimental in the long-run as you lose sight of the process that you need to follow that helps you achieve positive results. Trading is about always knowing where you are and correcting course when you see that you have gone astray.

Here are some ideas for keeping you focused on the process: review your trading plan regularly, journal, conduct periodical reviews of your trading activity, and take breaks away from the market on a regular basis to reflect. All of these are effective at keeping you in touch with what you are doing and helping keep you on a steady course.

China Economy Expands by 5.3% Year-on-Year in the First Quarter

Quarter-on-quarter, the Chinese economy grew by 1.6% after expanding by 1.0% in Q4. Economists forecast the economy to grow by 0.9%.

The first quarter figures were significant after Beijing set a growth target of 5.0% for 2024.

Other economic indicators sent mixed signals.

Industrial production increased by 4.5% year-on-year in March after rising 7.0% in February. Retail sales advanced by 3.1% after advancing by 5.5% in February. Economists forecast industrial production and retail sales to increase 5.4% and 4.5%, respectively. The figures signaled a loss of momentum at the end of the first quarter.

However, fixed asset investment and unemployment figures suggested a possible shift in momentum. Fixed asset investment increased 4.5% year-on-year, while the Chinese unemployment rate fell from 5.3% to 5.2%. Economists forecast fixed asset investments to increase 5.3% and the unemployment rate to fall to 5.2%.

The Aussie Dollar Reaction to the Numbers from China

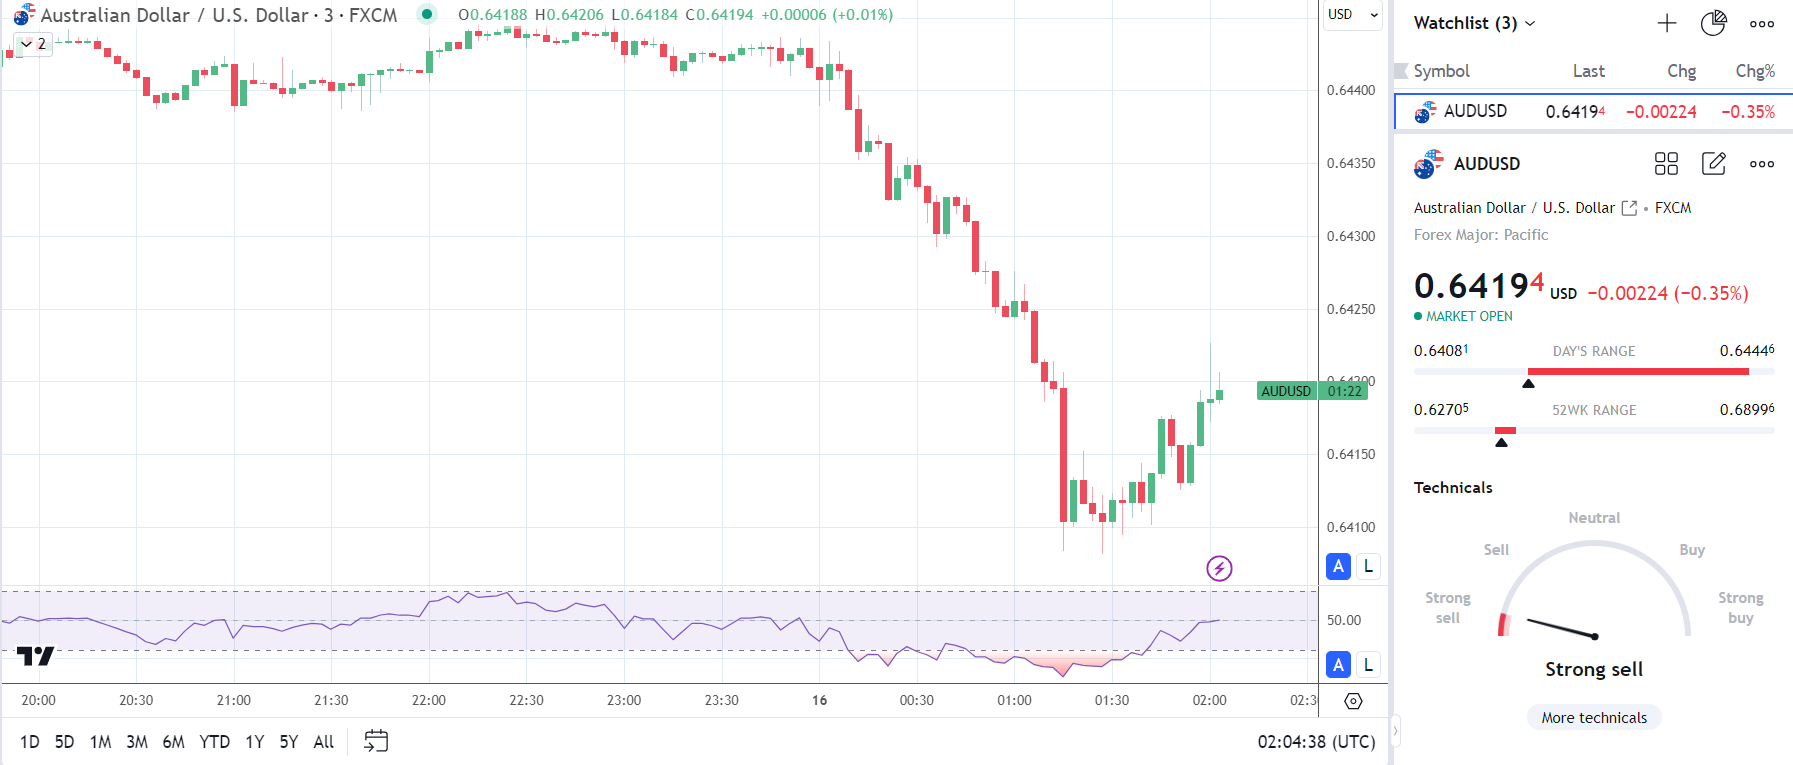
Before the economic indicators from China, the AUD/USD rose to a high of $0.64446 before falling to a low of $0.64081.

However, in response to the stats from China, the Aussie dollar rose to a high of $0.64226 before falling to a low of $0.64172.

On Tuesday, the AUD/USD was down 0.35% to $0.64194.

Aussie dollar has a mixed reaction to the numbers from China.
160424 AUDUSD 3 Minute ChartHousing sector data from the US will garner investor interest. Economists expect housing starts to decline by 0.8% in March after surging 10.7% in February. Moreover, economists predict building permits to fall by 0.7% after increasing by 2.4% in February.

Housing sector data could influence the Fed rate path. FOMC member Austan Goolsbee recently spoke about the effects of housing services inflation on headline inflation. Improving housing sector conditions could fuel housing services inflationary pressures.

In addition to the housing sector numbers, US industrial production figures for March will also draw interest. Economists forecast industrial production to advance by 0.2% month-on-month in March. Nevertheless, the housing sector data will likely influence the Fed rate path more.

Beyond the numbers, investors should track FOMC member commentary and news updates from the Middle East

GBP/USD Extends Losses as UK Labor Market Shows Signs of Weakness

According to the latest Office for National Statistics data, the UK unemployment rate reaches 4.2% in February, surpassing market expectations of 4.0% and the previous month’s reading of 3.9%. Average earnings, including bonuses, remain unchanged at 5.6%, while earnings excluding bonuses decrease slightly by 0.1% to 6.0%. The current UK labor market statistics demonstrate a slight uptick in unemployment and a stable wage growth trend, providing insights into the country’s economic health and employment landscape.

image1.png

The upcoming UK inflation report for March is now crucial for the short- to medium-term outlook of the British Pound (GBP). The UK inflation rate has been declining rapidly over the past year after touching 10.4% in March of the previous year. Analysts expect the headline UK inflation to drop further, from 3.4% in February to 3.1% in March, bringing it closer to the Bank of England’s (BoE) target of 2%. The central bank is closely monitoring this release and may signal that interest rate cuts could happen sooner than anticipated. Current market expectations indicate a 60% probability of a 25 basis point cut at the BoE’s meeting on August 1st. If the inflation rate continues to fall, this probability is likely to increase. The March UK inflation data will play a significant role in shaping the GBP’s performance and influencing the BoE’s monetary policy decisions in the coming months.

image2.png

As the US dollar strengthens and the British Pound (GBP) weakens, the GBP/USD currency pair’s path of least resistance continues to trend lower. The recent break below all three simple moving averages on Wednesday has contributed to the negative market sentiment surrounding the GBP/USD. Furthermore, the pair has easily broken through previous support levels around 1.2547 and the significant psychological level of 1.2500. Technical analysis of the GBP/USD chart reveals the next two support levels at 1.2381 and 1.2303, which may be tested soon. Traders and investors closely monitor these key levels to gauge the GBP/USD’s performance and potential trading opportunities in the current market environment, characterized by a robust US dollar and a weakening Sterling.

GBP/USD Daily Price Chart

image3.png

IG Retail data shows 67.80% of traders are net-long with the ratio of traders long to short at 2.11 to 1.The number of traders’ net long is 2.78% lower than yesterday and 35.65% higher than last week, while the number of traders’ net short is 7.65% higher than yesterday and 31.33% lower than last week.

We typically take a contrarian view to crowd sentiment, and the fact traders are net-long suggests GBP/USD prices may continue to fall.


The Bank of England: A Forex Trader’s Guide

What is the Bank of England (BOE)?

Established in 1694, the Bank of England is the banker to, and owned by, the British government but is independent when setting monetary policy. Its roles include the setting of monetary policy – which includes targeting interest rates and using other tools to stimulate or contract the economy – producing the UK’s bank notes, supervising some bank payment systems, and ensuring the stability and safety of the financial system.

For traders, the BOE’s setting of monetary policy is a key factor to consider as it can have a big impact on the financial markets. Other factors, like the independence of the central bank are also important but are more prevalent issues in emerging market economies.

Key Economic Mandates of the Bank of England

According to the Bank of England, their two core purposes or mandates are:

1) Monetary stability – which is price stability or inflation

2) Financial stability – which is the stability and health of the economy

Monetary Stability

Monetary policy is extremely important for the entire economy. It prevents runaway inflation and attempts to ground inflation expectations so that the economy can grow at a regular pace. In order to maintain price stability, the Bank of England and their monetary policy committee (MPC) have set an inflation target of 2%.

If inflation goes above the target of 2% the Bank of England may increase interest rates. The increase in interest rates may cause an appreciation in the Pound as investors increase capital flows into the higher yielding currency. It may also have a negative affect on the stock market, as businesses will have to pay higher rates to lend and equity valuations will be discounted at a higher interest rate. Monetary policy data can be found on our economic calendar.

However, it is not always the case that the Bank of England will increase interest rates if inflation is above target. In some cases, like when GDP growth is still low or negative, the Bank of England may keep interest rates low to stimulate the economy. It is important to know the Bank of England will be looking for a balance between healthy inflation and economic growth.

Financial Stability

The resilience of the financial system is paramount to the health of the UK economy and therefore necessary for the Bank of England to accommodate. To support Financial Stability mandates, the bank also has a Financial Policy Committee or FPC which was established in June 2011. From an FX point of view, the Monetary Stability is the key driver of spot rates for the GBP.

 How BOE interest rates affect the Pound

Interest rate impact on the Pound

The Bank of England can affect the value of the Pound through changes in interest rate expectations. Traders should understand that currencies appreciate when interest rate expectations increase, not just from increases in the nominal interest rate.

For example, if the Bank of England keeps interest rates unchanged but issues forward guidance (tells the market) that they expect more interest rate hikes in future, the value of the Pound will appreciate. Likewise, decreases in future interest rate hike expectations, or expectations of an interest rate cut can lead to a decrease in the value of the Pound.

This is the general principle for how interest rates affect the Pound and stock market, although they sometimes react differently:

  1. Higher interest rate expectations increase the strength of the Pound (GBP) and negatively affect equity values.
  2. Lower interest rate expectations decrease the strength of the Pound (GBP) and positively affect equity values.

Interest rates aren’t the only monetary policy tool that can affect the currency, tools like quantitative easing can also lead to increases and decreases in the value of a currency. If the Bank of England announces that it plans to start a quantitative easing program (QE), the pound will likely depreciate as a large amount of liquidity enters the market, increasing the supply of money in the market and leading to a decrease in interest rates, or, simply to maintain current rates.

Interest rate impact on the economy

The Bank of England lowers interest rates when it is trying to stimulate the economy (GDP) and increases interest rates when it is trying to contain inflation caused by an economy operating above potential (overheating).

Lower interest rates stimulate an economy in a few ways:

  1. Businesses can borrow money and invest in projects that will receive more than the risk borrowing rate.
  2. When interest rates are lower the stock market is discounted at a lower rate, leading to an appreciation in stock market values which causes a wealth effect.
  3. People invest their money into the economy (stocks and other assets) because they can earn more in these assets than at currently low interest rates.

The table below displays the possible scenarios that come from a change in interest rate expectations. Traders can use this information to forecast if the currency is likely to appreciate or depreciate and how to trade it.

Market expectations Actual Results Resulting FX Impact
Rate Hike Rate Hold Depreciation of currency
Rate Cut Rate Hold Appreciation of currency
Rate Hold Rate Hike Appreciation of currency
Rate Hold Rate Cut Depreciation of currency

Let’s look at the example below on GBP/USD. On August 4, 2016 the Bank of England cut interest rates and announced a stimulus package (quantitative easing program). The market reacted negatively and the Pound depreciated.
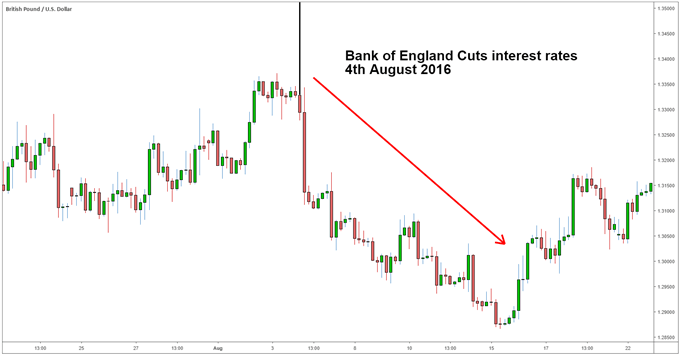
Bank of England cuts interest rate to new low

Top Takeaways of the BOE and Forex Trading

  • The Bank of England is fundamental to the value of the Pound
  • The Pound will appreciate or depreciate depending on changes in interest rate expectations, not just on actual changes.
  • Quantitative easing has a similar effect to changes in interest rates. Changes in expectations of quantitative easing will have an effect on the Pound.
  • Rising inflation does not mean the Bank of England will increase interest rates, it depends on the balance between economic growth and inflation.
Psychological Levels & Round Numbers in Forex Trading

What are psychological levels and how do they work?

Psychological levels are market price levels which are often key levels in forex denoted by round numbers. These round numbers frequently act as levels of support and/or resistance.

Psychological support and resistance consistently work because of fundamental human disposition. Human beings value simplicity; from a trading perspective this means valuing whole numbers. Traders often use these numbers as entry, exit or stop levels. These stops and limits can alter order flow and price changes.

Identifying psychological levels on forex charts

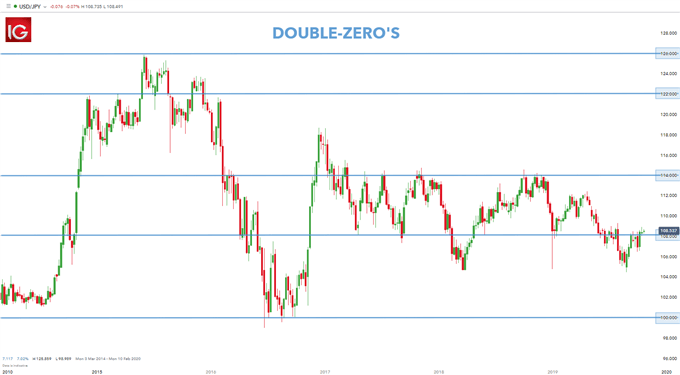
Traders will often call these whole number intervals ‘double-zeros,’ as these prices are at even numbers such as 1.31000 on EUR/USD, 1.57000 on GBP/USD or 132.00 on GBP/JPY. The chart below identifies the ‘double-zeros’ on the current USD/JPY chart.

psychological levels double-zero round numbers on USD/JPY chart

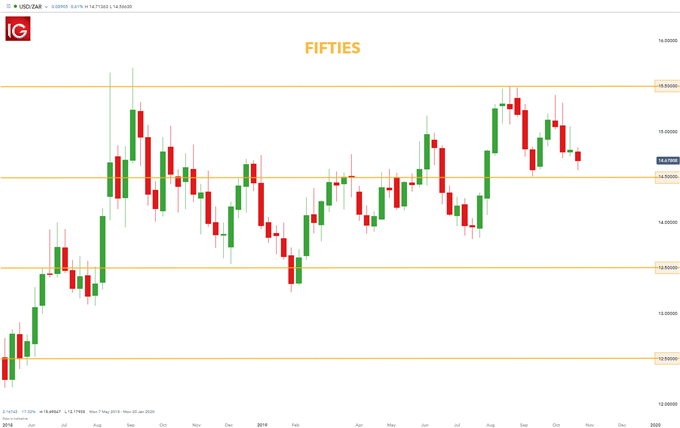
Some traders will take this a step further by looking at the number directly in the middle of these whole numbers or ‘the fifties.’ These levels, such as 1.31500 on EUR/USD or 131.50 on GBP/JPY can often come into play in the same manner as the ‘double-zeros.’

Traders will notice that there will often be some element of congestion at these key levels in forex as prices move up or down. The chart below illustrates USD/ZAR with ‘fifties’ denoted.

psychological levels the fifties USD/ZAR

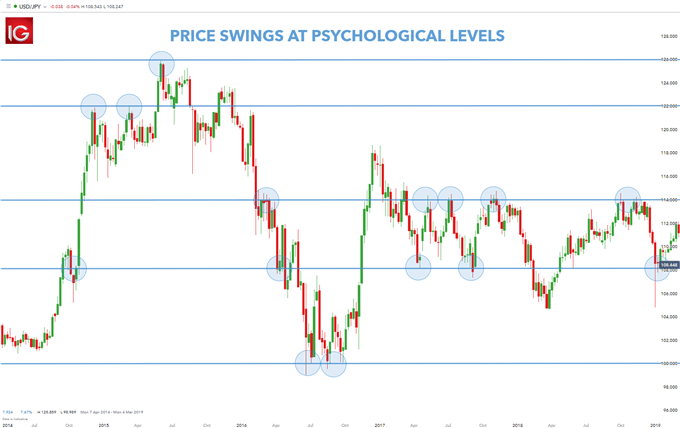
Notice that many of the price swings on the above chart take place around one of these levels. Therefore, traders want to incorporate these levels into the support and resistance revisions. The chart below represents the initial USD/JPY chart with identified swing levels.

price swings at psychological levels

Consequently, these prices act as a psychological line which work well as support and resistance. Not every one of these prices act as a function of support or resistance, but enough do that these levels warrant the trader’s attention.

How to use psychological levels in forex trading

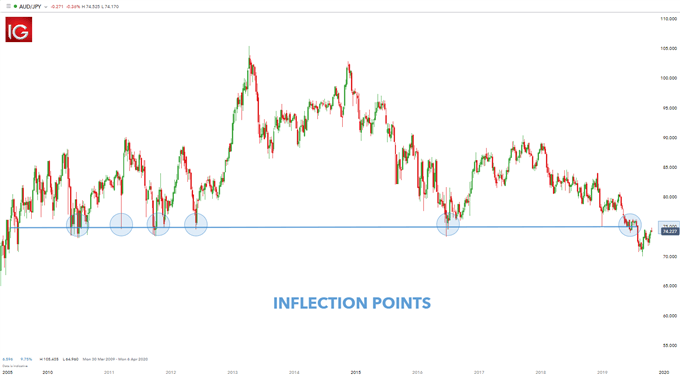
AUD/JPY weekly chart

forex inflection points

On the AUD/JPY chart above there are six strong inflections off the 75.00 price level. Each time price approached 75.00, the currency pair bounced back up. This is because:

  1. Traders saw the price of 75.00 and believed this is cheap which prompted long AUD trades off this level.
  2. As traders were opening short positions, profit targets were set at an even 75.00. This profit target order to close positions created demand in the market (traders were buying to cover, and this buying interest is considered ‘demand’).

After the first inflection, traders may not have been extremely bullish on the prospect of pushing price much lower than 75.000 as this price has already been exhibited as support.

In many ways, untested ‘psychological’ levels can be looked at like pivot points. An area where there maybe some element of support or resistance.

In general, round numbers such as 70.000 on AUD/JPY or 1.0000 on AUD/USD will garner more attention than a more pedestrian level like 71.000 on AUD/JPY. Most traders will often assign a higher degree of strength to the more rounded-intervals.

Where traders can really find value with these levels is when prices may have resisted or been supported there in the past. This tells the trader that others are noticing and acting on those prices, and the potential for the ‘self-fulfilling prophecy’ of technical analysis may potentially be considered with more strength.

 Advantages and limitations of psychological levels

Key levels in forex should be assessed in line with the current trend and whether there is secondary technical suggestions in favor of the trade. Below are the advantages and limitations of psychological levels:

Overbought vs. Oversold and What This Means for Traders

Overbought vs Oversold talking points:

  • Overbought means an extended price move to the upside; oversold to the downside
  • When price reaches these extreme levels, a reversal is possible
  • The Relative Strength Index (RSI) can be used to confirm a reversal

OVERBOUGHT VS OVERSOLD

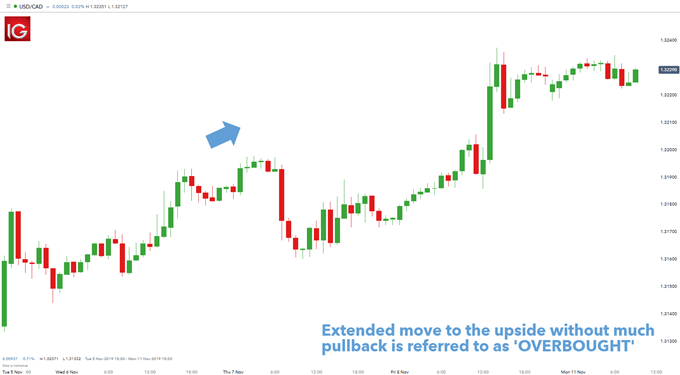
These two terms actually describe themselves pretty well. Overbought defines a period of time where there has been a significant and consistent upward move in price over a period of time without much pullback. This is clearly defined by a chart showing price movement from the “lower-left to upper-right” like the chart shown below.

LEARN FOREX: USD/CAD HOURLY CHART – OVERBOUGHT

USD/CAD hourly chart overbought

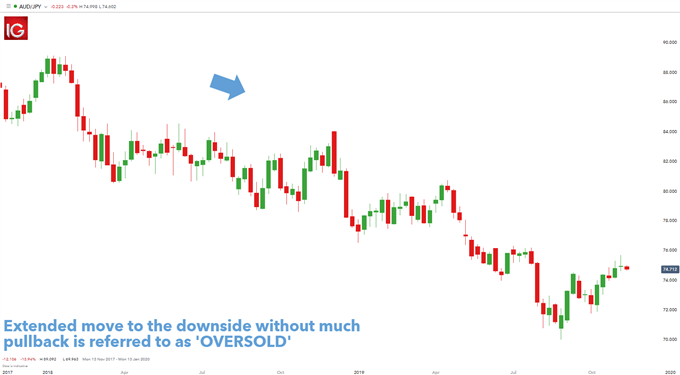
The term oversold illustrates a period where there has been a significant and consistent downward move in price over a specified period of time without much pullback. Essentially, a move from the “upper-left to the lower-right” – see chart below.

LEARN FOREX: AUD/JPY WEEKLY CHART – OVERSOLD

AUD/JPY hourly chart oversold

Since price cannot move in one direction forever, price will turn around at some point. Currency pairs that are overbought or oversold sometimes have a greater chance of reversing direction however, could remain overbought or oversold for a very long time. Therefore, traders need to use an oscillator to help determine when a reversal could occur.

OVERBOUGHT OVERSOLD INDICATOR READINGS WITH RSI

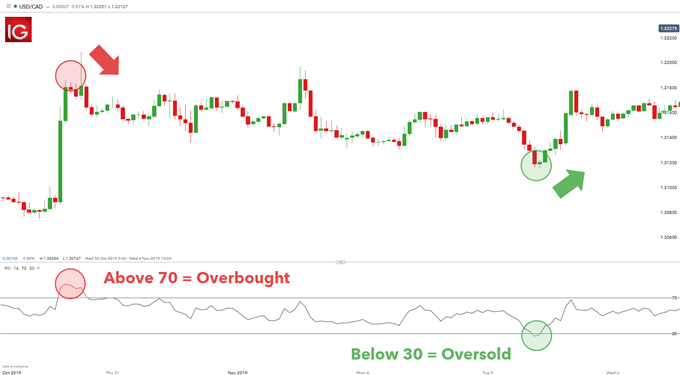
There is a quick tool traders can use to gauge overbought and oversold levels, the Relative Strength Index (RSI). The premise is simple, when RSI moves above 70, it is overbought and could lead to a downward move. When RSI moves below 30, it is oversold and could lead to an upward move.

RSI OVERBOUGHT AND OVERSOLD LEVELS:

USD/CAD RSI overbought vs oversold levels

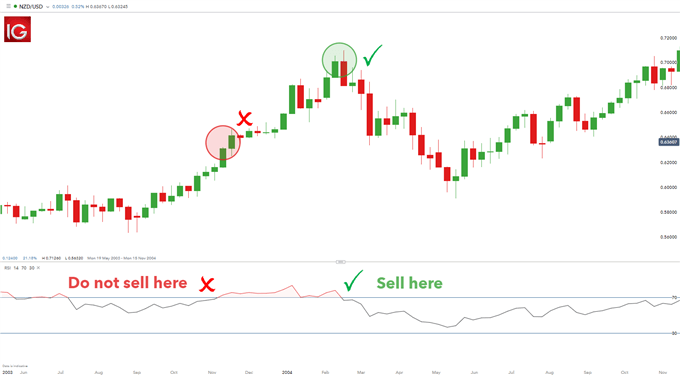
Traders need to be patient before entering trades using the RSI as on occasion the RSI can stay overbought or oversold for a prolonged period as seen on the chart below. A common error made by traders is attempting to pick a top or bottom of a strong move that continues to move further into overbought or oversold territory. The key is to delay until the RSI crosses back under the 70 or over the 30 as an instrument to enter.

 RSI PROLONGED OVERBOUGHT AND OVERSOLD SIGNALS

NZD/USD hourly chart overbought

The image above shows the RSI clearly breaking above the 70 level resulting in an overbought reading, but a seasoned trader will not look to immediately sell because there is uncertainty as to how far price could continue to rally. Traders ideally will wait until the RSI falls back below 70 and then place a short trade. This gives a better entry and a higher probability trade. When the RSI falls below 30, same rules apply.

FREQUENTLY ASKED QUESTIONS (FAQs)

How reliable are overbought and oversold signals?

Overbought and oversold signals as a solitary signal is not entirely reliable. Think of building a house; a builder is reliant on a hammer but as an isolated tool, the hammer is worthless when building an entire house. Other tools will be needed in conjunction with the hammer for construction – saw, drill etc. The same concept relates to overbought/oversold signals which requires complimentary tools to strengthen the signal, and eventually allow traders to make sound trade decisions. For example, trend identification, risk management and sentiment are useful tools that help compliment overbought and oversold signals.

What can traders do to strengthen/support overbought and oversold signals?

There are several common tools that can be used to compliment overbought and oversold signals. Below is a list of tools that can enhance your trading decisions:

  1. Identify the trend – Filtering for the trend can aid traders in selecting entry points using overbought and overbought signals. For example, in an uptrend traders will filter for oversold signals as ‘long entry’ points which correlate to direction of the trend. The opposite will apply to a downtrend.
  2. Risk management – Using proper risk-reward ratios which relate to stop and limit levels should be adhered to.
  3. Sentiment– Utilize client sentiment data to further verify overbought and oversold signals.